环境说明:
操作系统 主机名 IP地址
Centos8(zabbix server) zabbix 192.168.91.134
Centos8(zabbix agent) web 192.168.91.137
进程监控
在agent端编写一个脚本,可以取出需要监控资源的状态值
$()里的这条命令串是过滤$1的进程并用wc -l计数,$1是可键入的值。
$0是去掉grep这条进程的本身
[root@web ~]# mkdir /scripts
[root@web ~]# vim /scripts/check_process.sh
[root@web ~]# cat /scripts/check_process.sh
#!/bin/bash
status=$(ps -ef |grep $1|grep -Ev "$0|grep"|wc -l)
if [ $status -eq 0 ];then
        echo '1'
else
        echo '0'
fi
//下面这几条意思是,上面一条命令的执行结果等于0则输出1,否则输出0。
//输出1则代表$1的进程数是0,也就是没有进程,说明服务出现问题。


给这个脚本添加执行权限
[root@web ~]# chmod +x /scripts/check_process.sh
[root@web ~]# ll /scripts/
total 4
-rwxr-xr-x 1 root root 133 Sep 12 12:11 check_process.sh
编辑agent端的配置文件
[root@web ~]# vim /usr/local/etc/zabbix_agentd.conf
UnsafeUserParameters=1			#是否启用自定义监控项,可选值为{1|0}
UserParameter=check_process[*],/bin/bash /scripts/check_process.sh $1

重启agent,生效作更改的配置
[root@web ~]# pkill zabbix_agentd
[root@web ~]# zabbix_agentd

//在Server端测试刚刚所做的进程监控配置
//在agent端yum安装一个httpd服务,但没有nginx服务。测试结果如下
[root@zabbix ~]# zabbix_get -s 192.168.92.130 -k check_process[httpd]
0
[root@zabbix ~]# zabbix_get -s 192.168.92.130 -k check_process[nginx]
1
在服务端的zabbix监控页面添加监控项
在配置栏的【Hosts】界面选择给哪台主机添加监控项,点击【items】
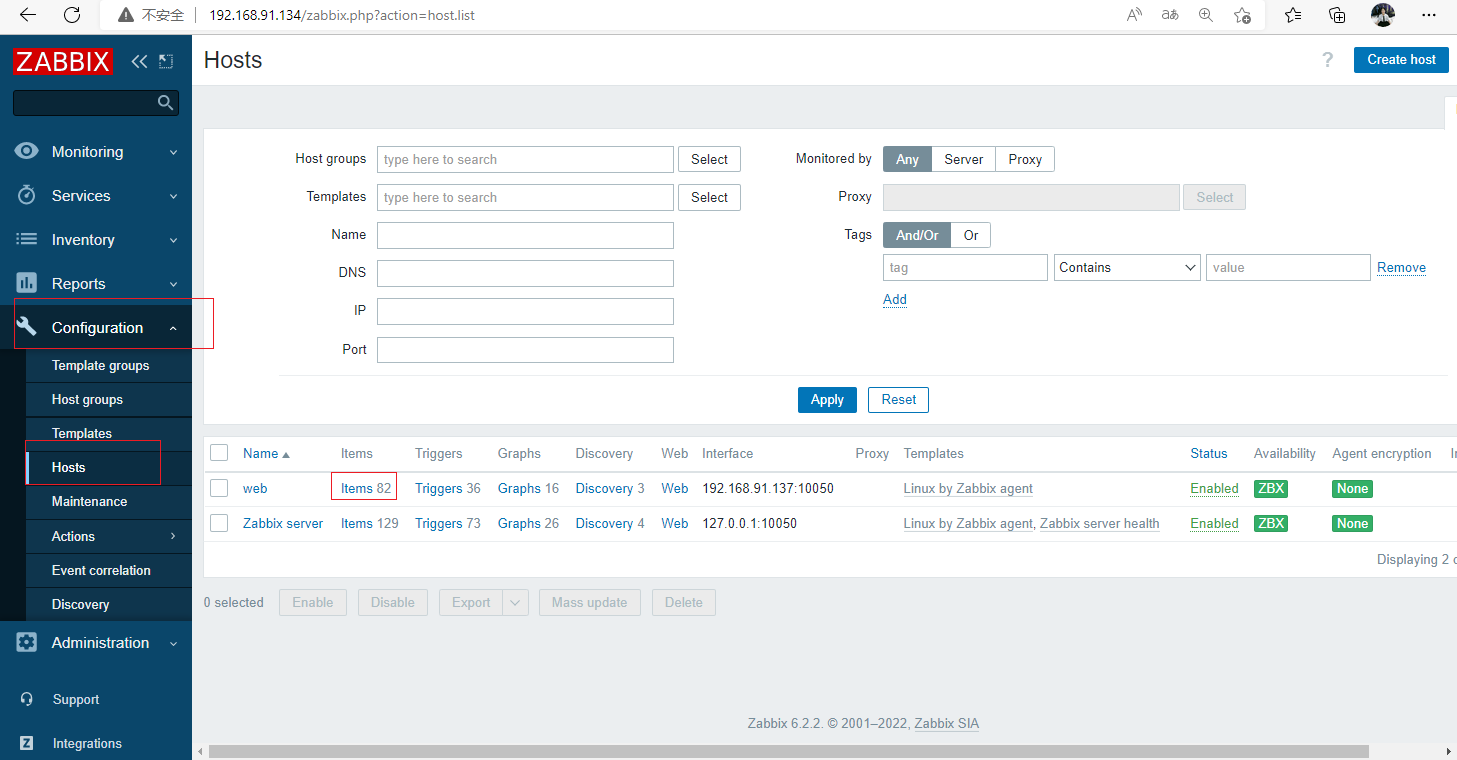
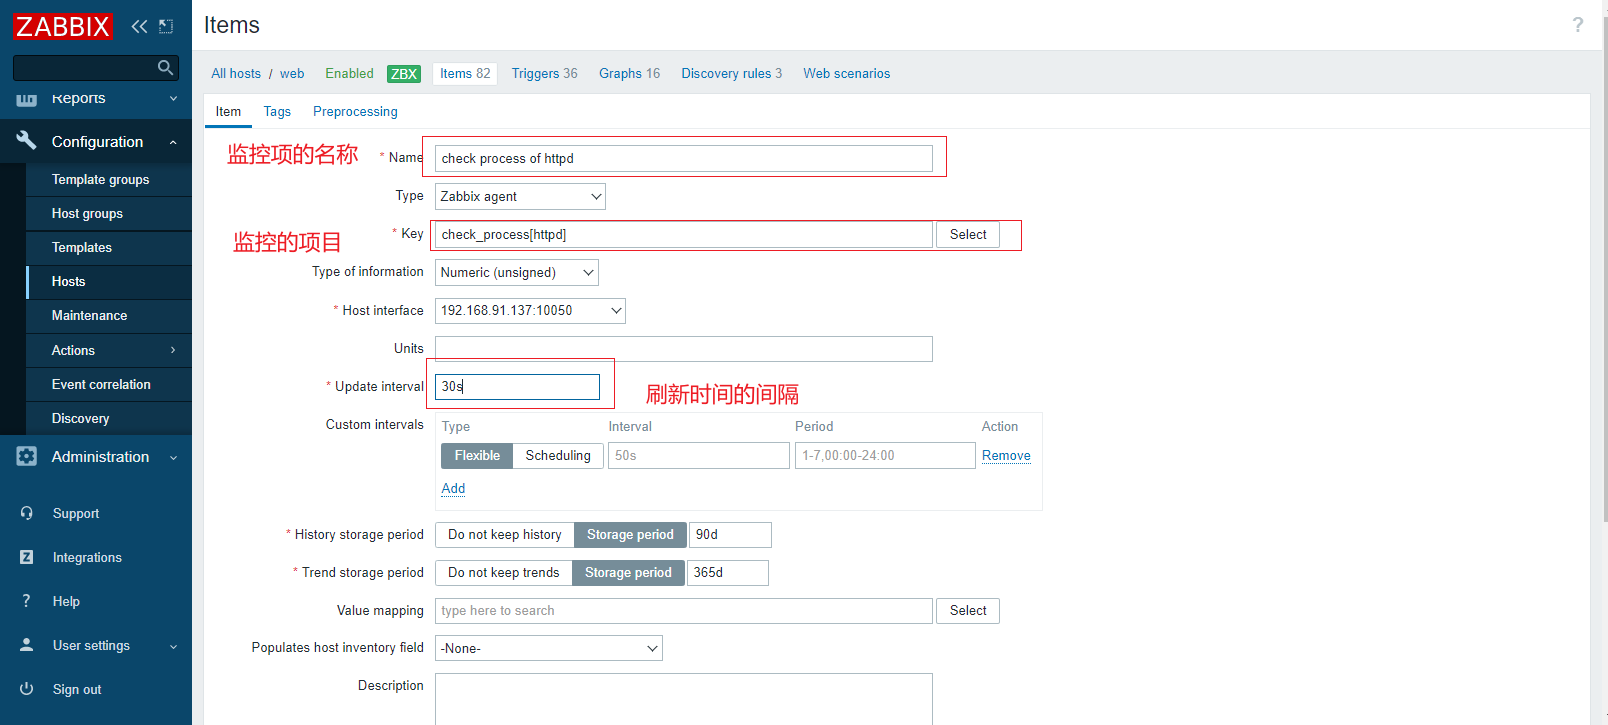
进入【items】界面后点击右上角的【Create item】创建监控项。
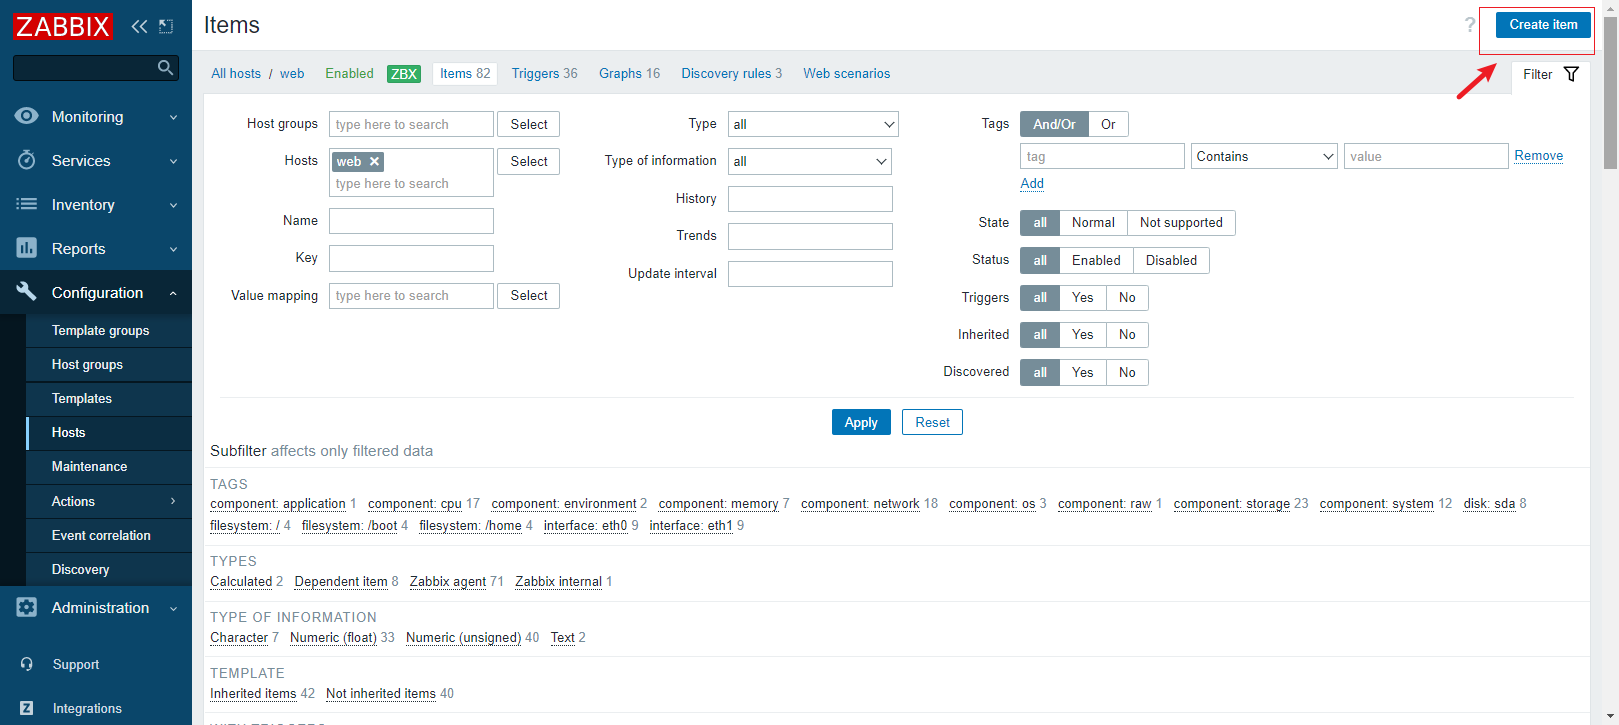
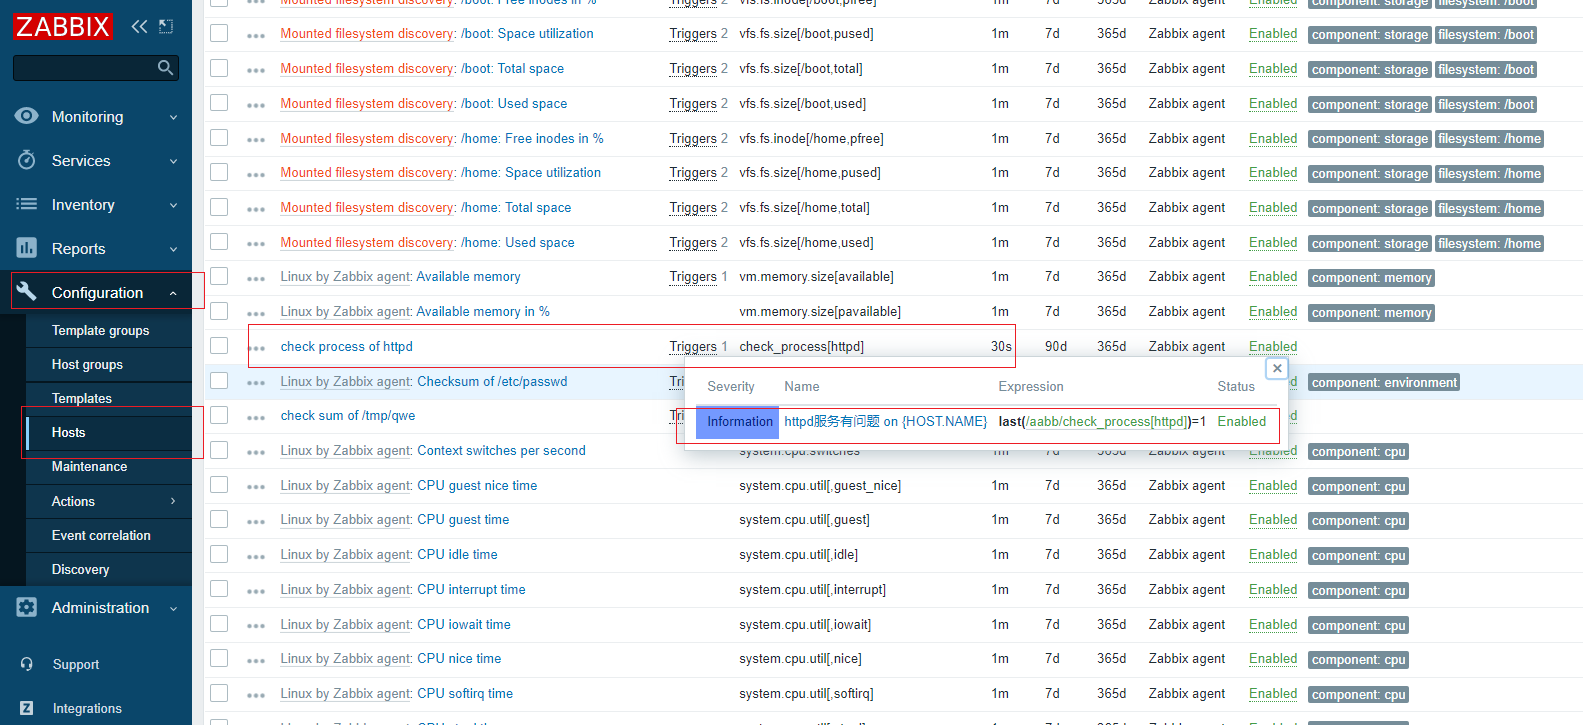
这里的key就是配置文件里的check_process[],我们这里监控httpd进程,就把换为httpd
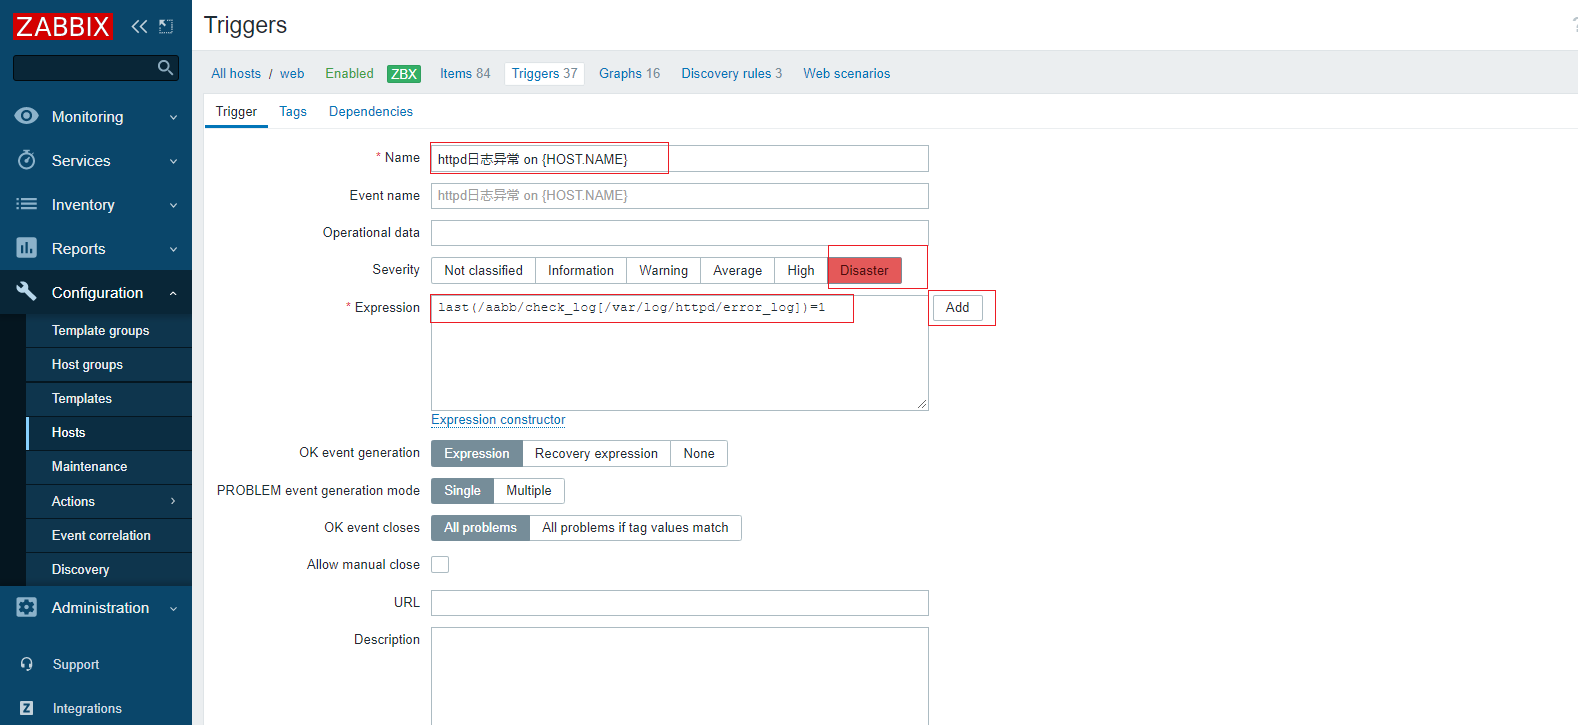
添加触发器
在配置栏的【Hosts】界面选择给哪台主机添加监控项,点击【Triggers】。
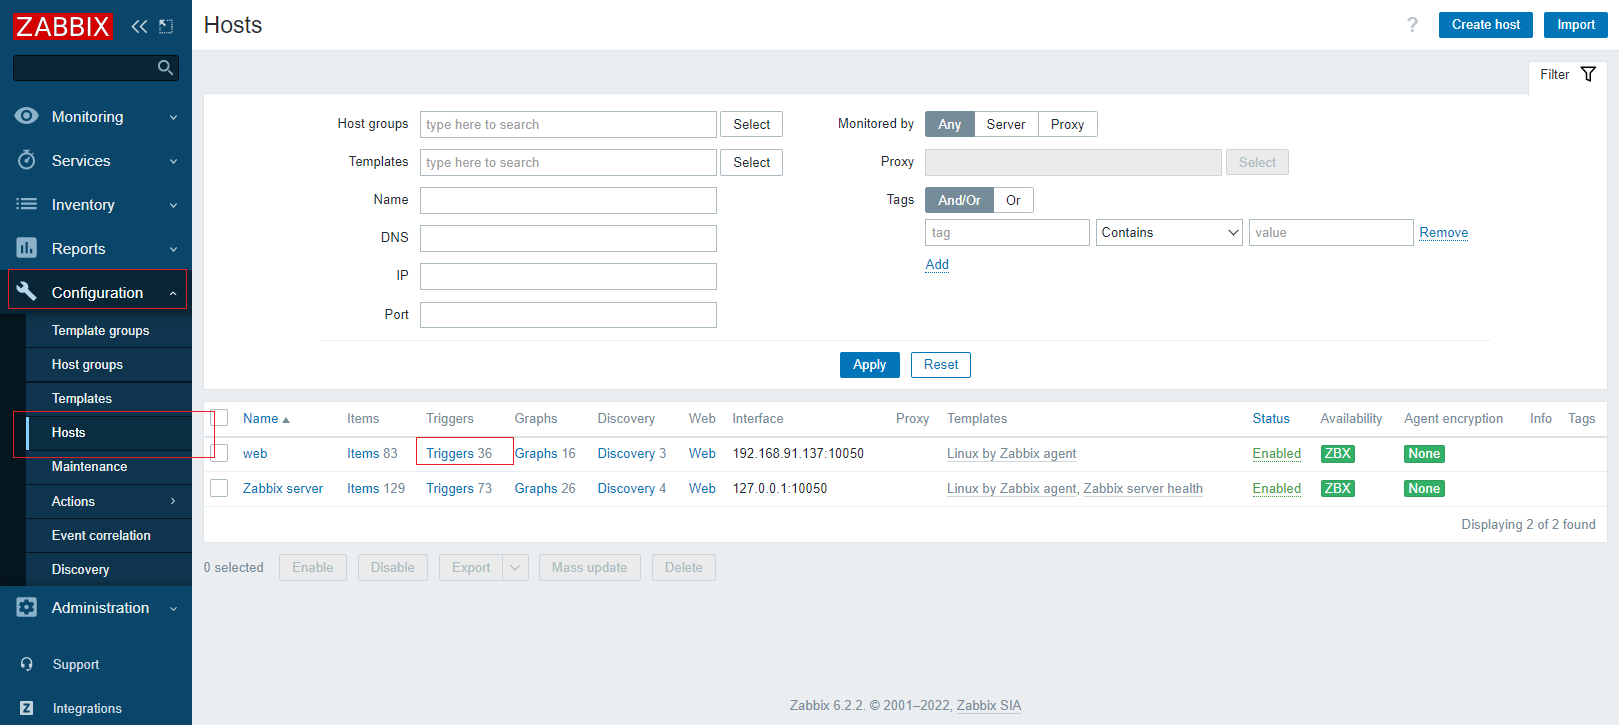
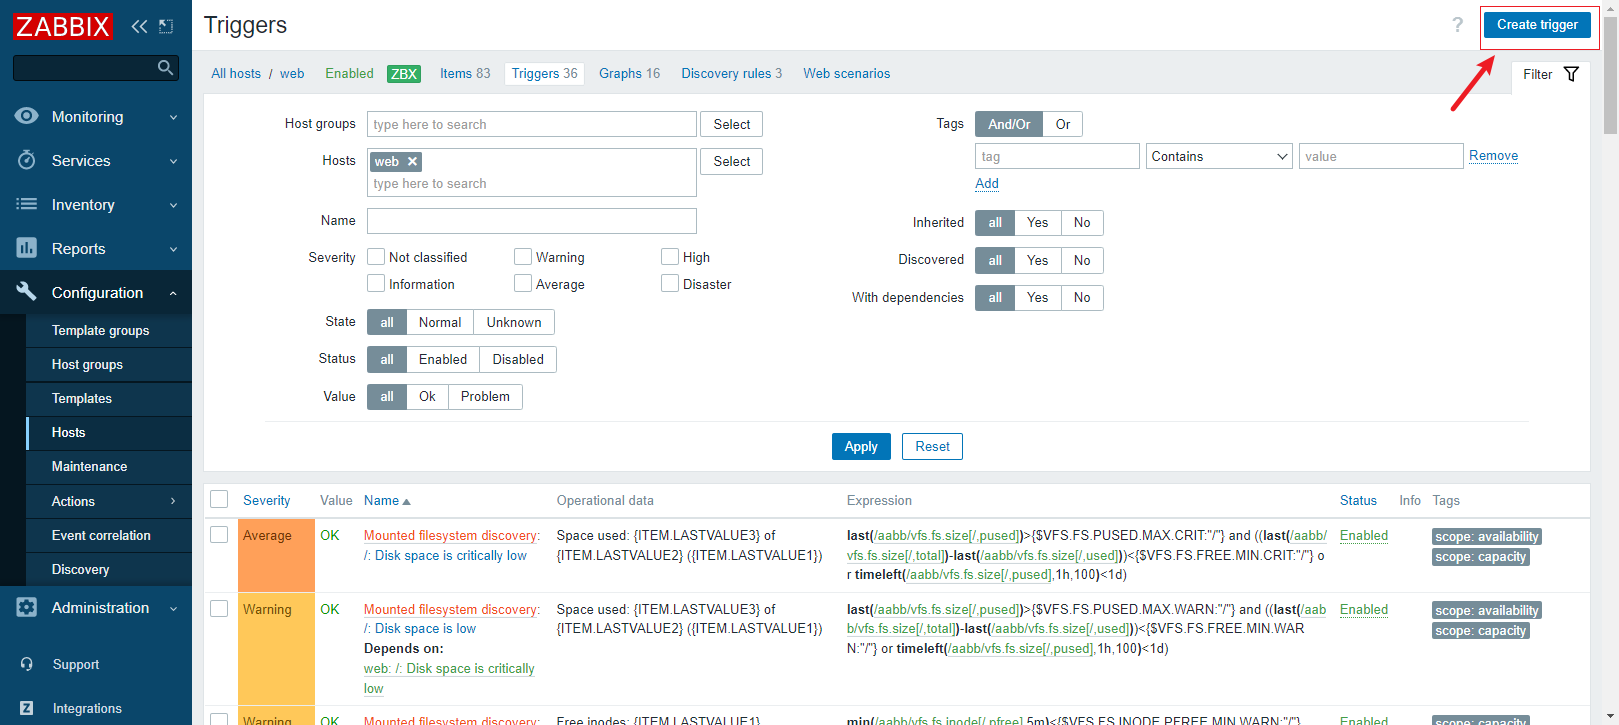
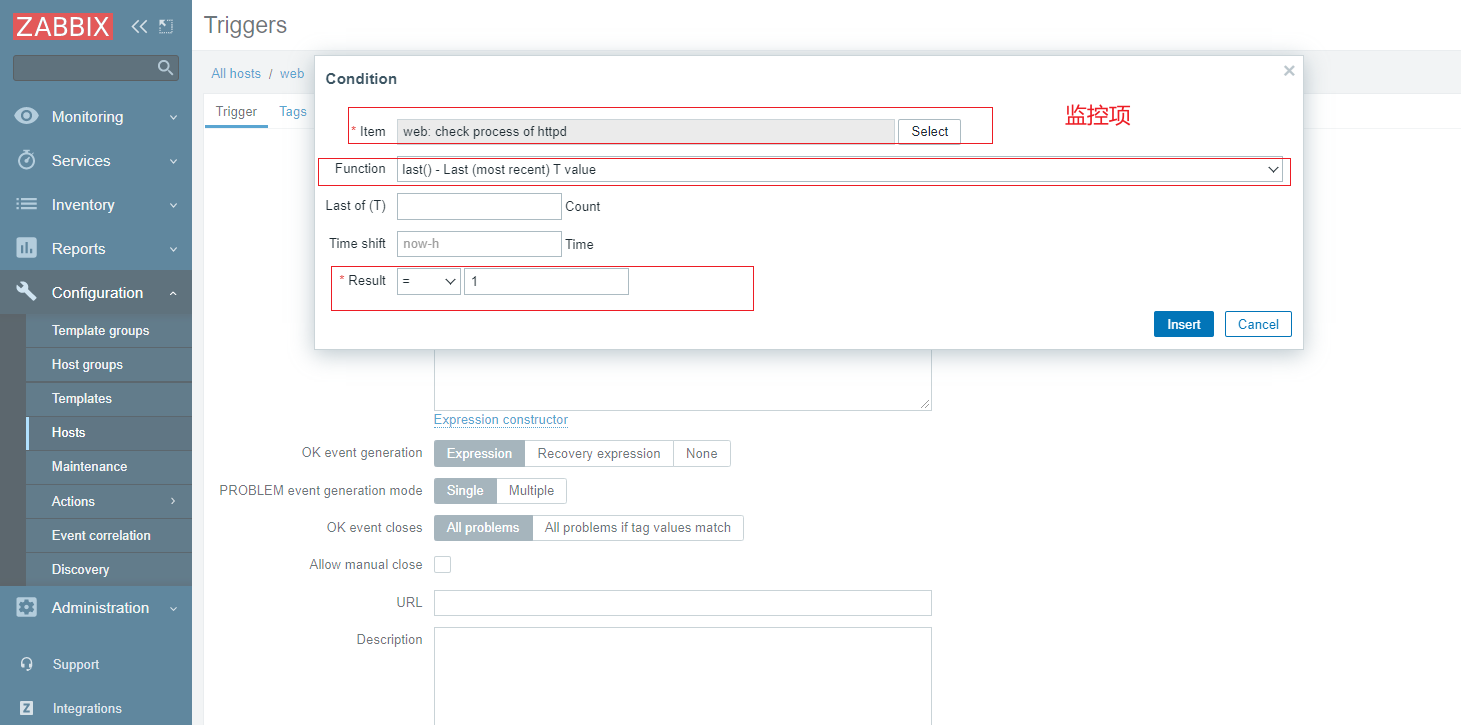
进入【Triggers】界面后,点击右上角的【Create trigger】创建触发器。
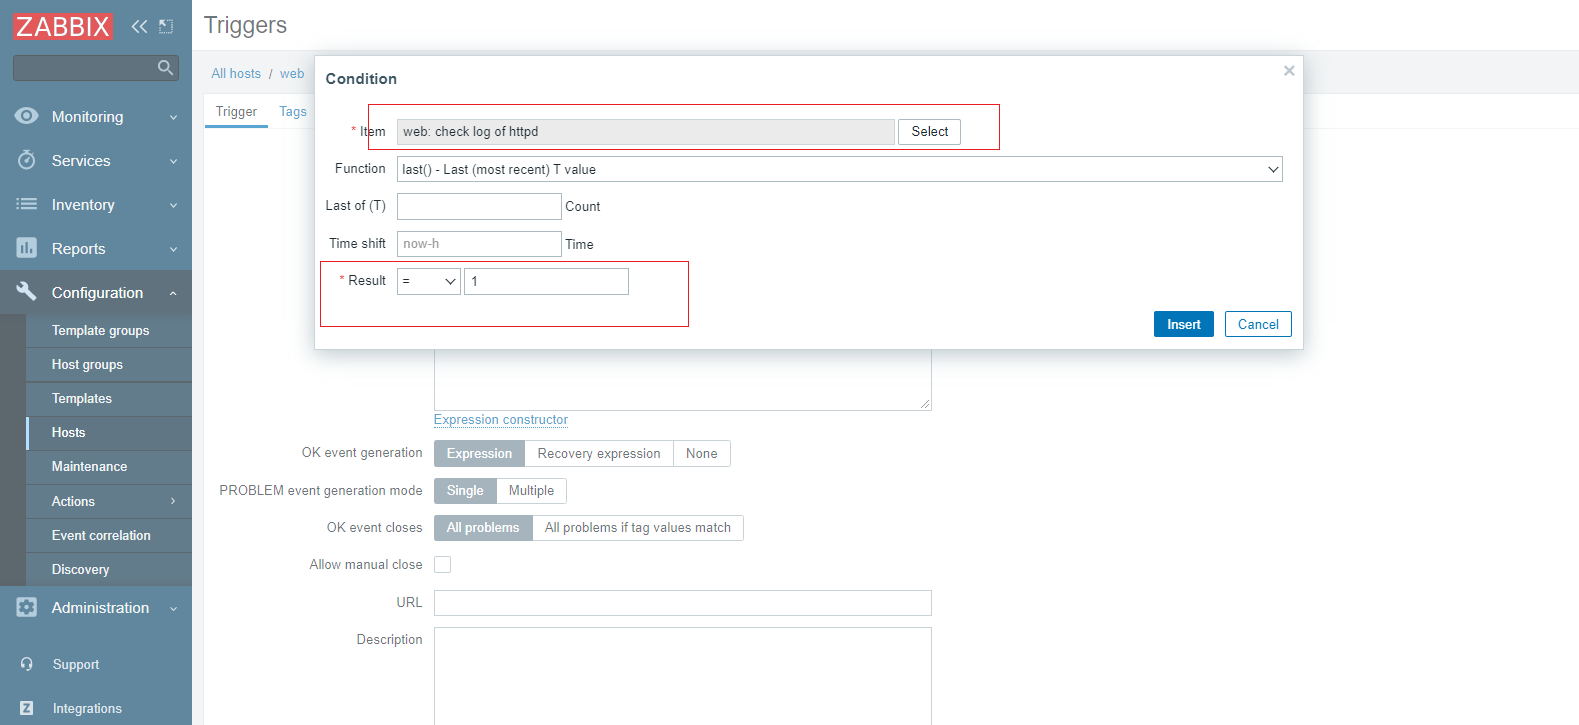
表达式的内容是先点击右边的【Add】进行添加的,添加的内容在下一张图中。
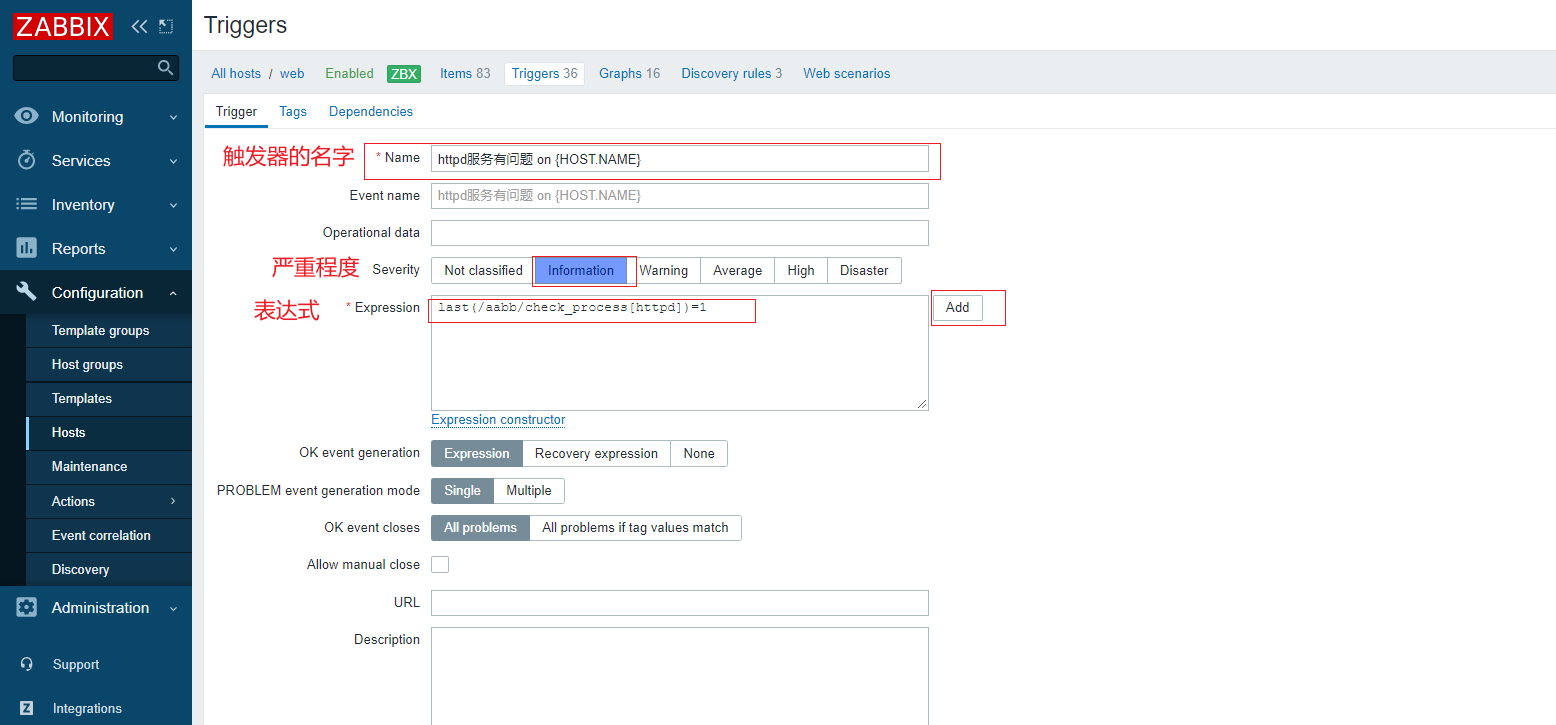
这条表达式是前面配置的脚本中$1键入httpd,如果脚本输出结果等于1则触发告警。
进入配置栏的【Hosts】界面后点击【items】。可以看到这条监控项有了一个触发器。
触发验证
手动触发告警,去agentd关闭httpd服务
[root@web ~]# systemctl stop httpd.service
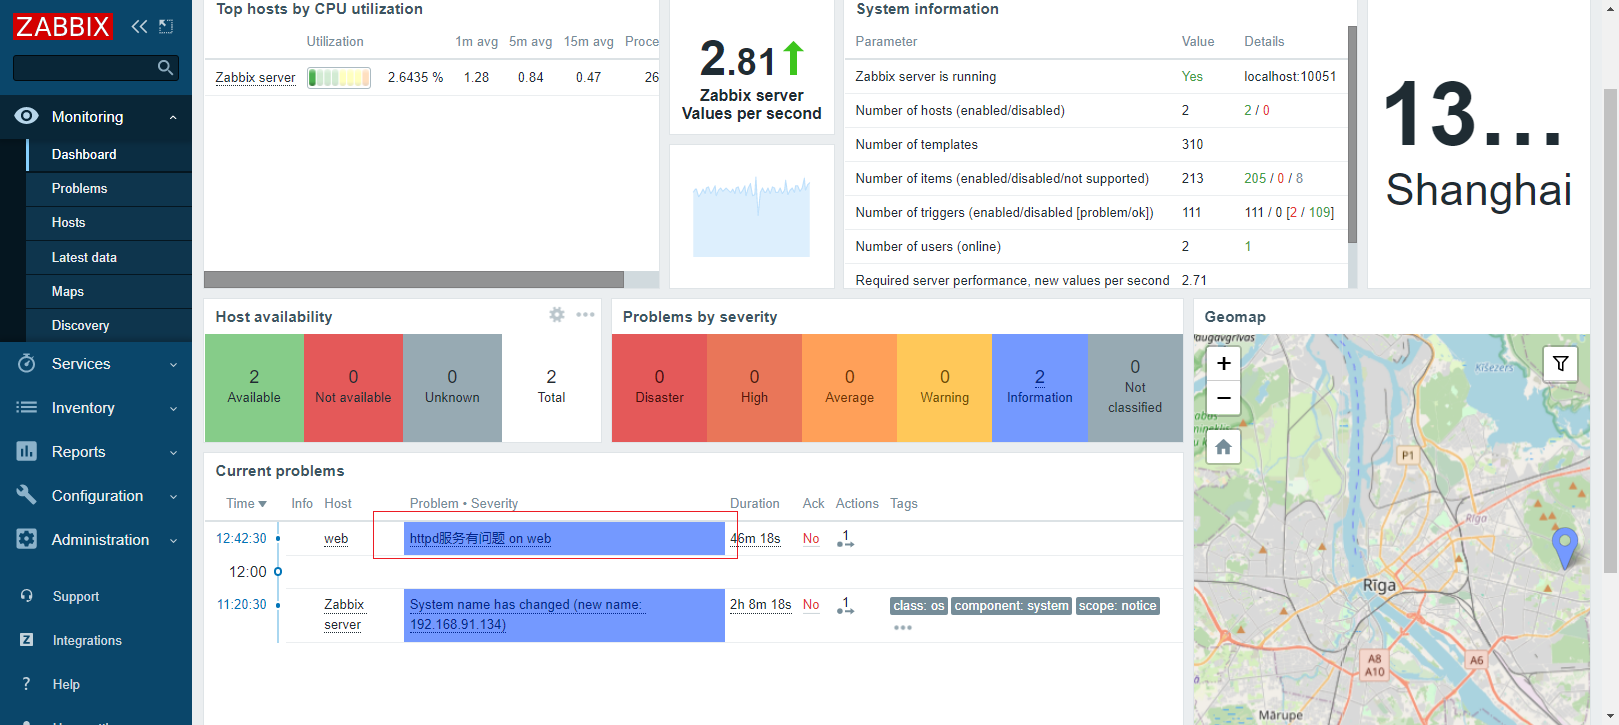
进入监控栏的仪表板界面查看,发现触发了告警
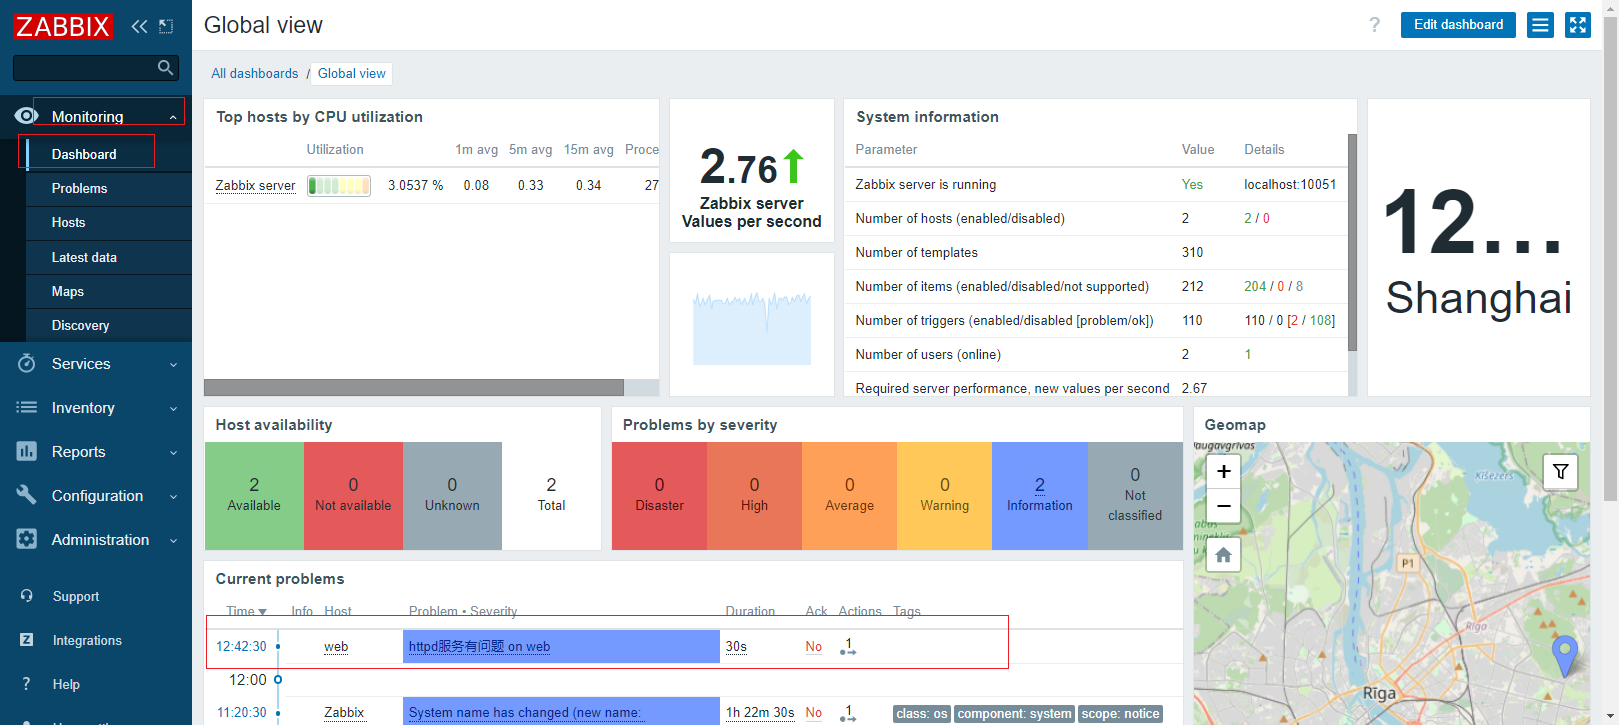
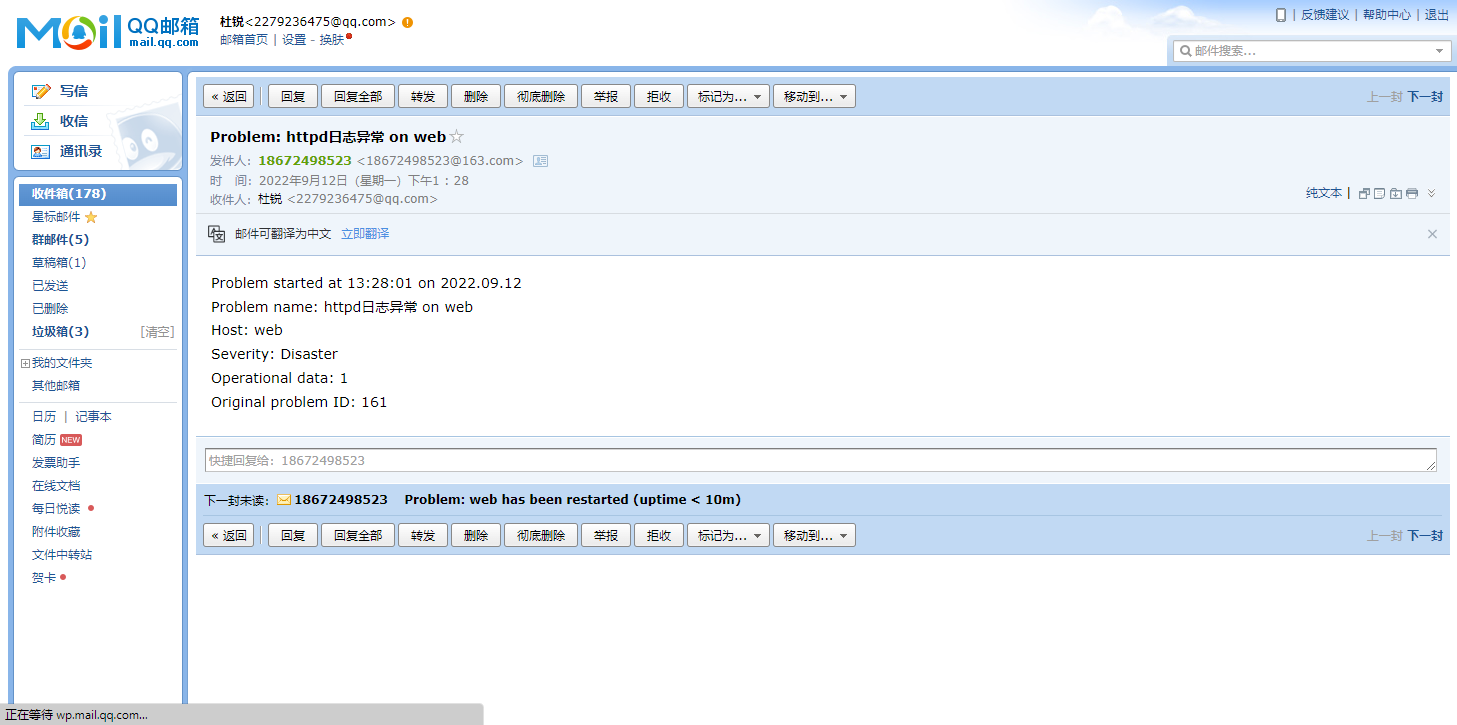
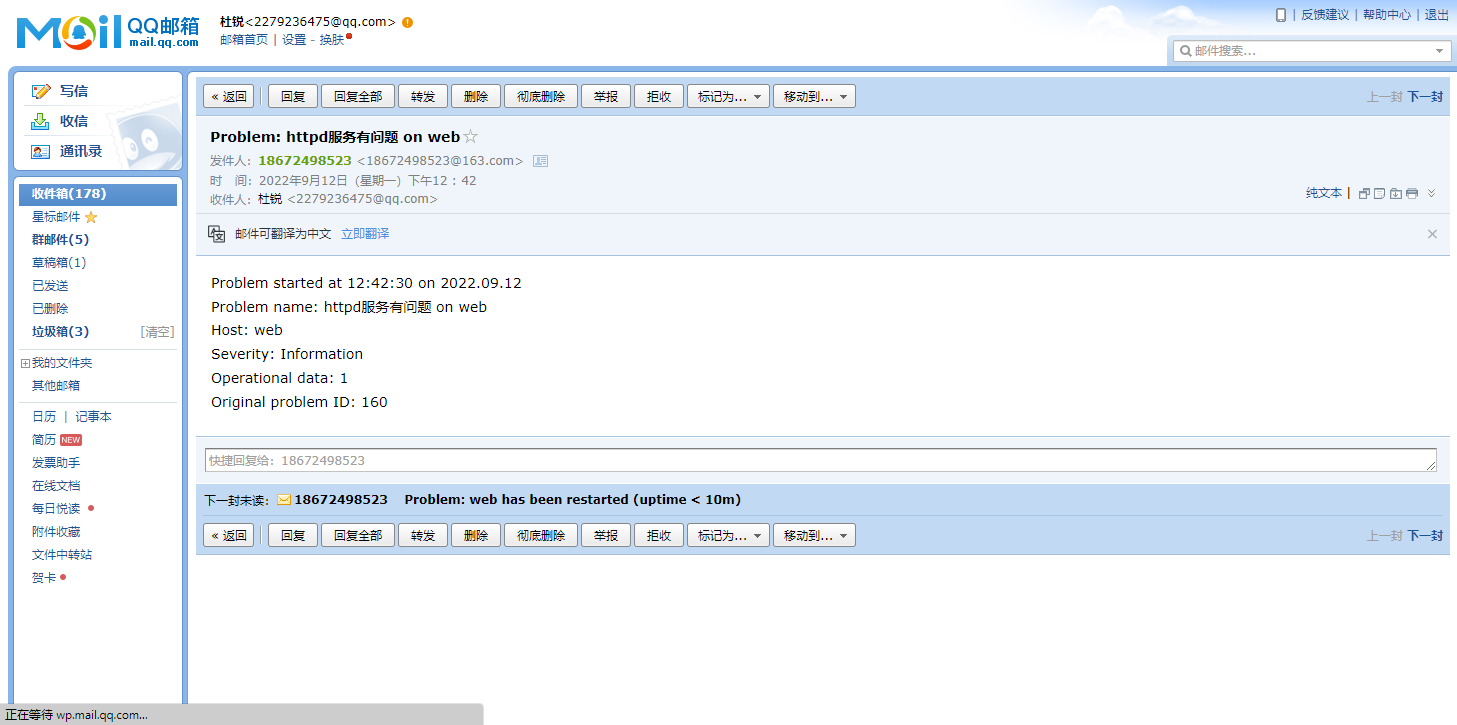
邮箱也发出警告了
日志监控
在agent端编写脚本,取出需要监控资源的状态值
//下载python的编译器
[root@web01 ~]# dnf -y install python3

//写python脚本。因shell脚本只能在Linux系统执行,如zabbix需要监控Windows系统\
//则需要python脚本,py脚本在这两操作系统都能运行

[root@web ~]# vim /scripts/log.py
#!/usr/bin/env python3
import sys
import re

def prePos(seekfile):
    global curpos
    try:
        cf = open(seekfile)
    except IOError:
        curpos = 0
        return curpos
    except FileNotFoundError:
        curpos = 0
        return curpos
    else:
        try:
            curpos = int(cf.readline().strip())
        except ValueError:
            curpos = 0
            cf.close()
            return curpos
        cf.close()
    return curpos

def lastPos(filename):
    with open(filename) as lfile:
        if lfile.readline():
            lfile.seek(0,2)
        else:
            return 0
        lastPos = lfile.tell()
    return lastPos

def getSeekFile():
    try:
        seekfile = sys.argv[2]
    except IndexError:
        seekfile = '/tmp/logseek'
    return seekfile

def getKey():
    try:
        tagKey = str(sys.argv[3])
    except IndexError:
        tagKey = 'Error'
    return tagKey

def getResult(filename,seekfile,tagkey):
    destPos = prePos(seekfile)
    curPos = lastPos(filename)

    if curPos < destPos:
        curpos = 0

    try:
        f = open(filename)
    except IOError:
        print('Could not open file: %s' % filename)
    except FileNotFoundError:
        print('Could not open file: %s' % filename)
    else:
        f.seek(destPos)

        while curPos != 0 and f.tell() < curPos:
            rresult = f.readline().strip()
            global result
            if re.search(tagkey, rresult):
                result = 1
                break
            else:
                result = 0

        with open(seekfile,'w') as sf:
            sf.write(str(curPos))
    finally:
        f.close()
    return result

if __name__ == "__main__":
    result = 0
    curpos = 0
    tagkey = getKey()
    seekfile = getSeekFile()
    result = getResult(sys.argv[1],seekfile,tagkey)
    print(result)

[root@web ~]# chmod +x /scripts/log.py
[root@web ~]# ll /scripts/
-rwxr-xr-x 1 root root 1854 Sep 12 12:51 log.py
[root@web ~]# /scripts/log.py  /var/log/httpd/error_log
0                       //测试一下该脚本是否可用,0代表没问题

//关于该文件请往下看写的log.py脚本的注释
[root@web ~]# cat /tmp/logseek
1023                   //该数字记录着读取到哪儿了

/用例子来说明2915这个数字是怎么来的
[root@web ~]# echo "test" >> /var/log/httpd/error_log
[root@web ~]# echo "test" >> /var/log/httpd/error_log
[root@web ~]# echo "test" >> /var/log/httpd/error_log

//执行脚本检查httpd的错误日志
[root@web ~]# /scripts/log.py  /var/log/httpd/error_log
0

//执行完脚本后,可以看到该文件的数字串发生了变化,相较之前的数+15了\
//多出来的15是因为前面往那个文件追加了三行test,4个字母乘以3加上三个换行符=15
[root@web ~]# cat /tmp/logseek
1038

//手动添加错误信息"Error"测试效果
[root@web ~]# echo "Error" >> /var/log/httpd/error_log
[root@web ~]# /scripts/log.py  /var/log/httpd/error_log
1
log.py脚本注释
作用:检查日志文件中是否有指定的关键字
第一个参数为日志文件名(必须有,相对路径、绝对路径均可)
第二个参数为seek position文件的路径(可选项,若不设置则默认为/tmp/logseek文件。相对路径、绝对路径均可)
第三个参数为搜索关键字,默认为 Error
在agentd端编辑配置文件
[root@web ~]# vim /usr/local/etc/zabbix_agentd.conf
UserParameter=check_log[*],/scripts/log.py $1 $2 $3		//添加这一条日志监控

//重启agent,生效配置
[root@web ~]# pkill zabbix_agentd
[root@web ~]# zabbix_agentd
[root@web ~]# ss -anlt
State           Recv-Q          Send-Q                   Local Address:Port                      Peer Address:Port          Process
LISTEN          0               128                            0.0.0.0:10050                          0.0.0.0:*
LISTEN          0               128                            0.0.0.0:111                            0.0.0.0:*
LISTEN          0               128                            0.0.0.0:22                             0.0.0.0:*
LISTEN          0               128                               [::]:111                               [::]:*
LISTEN          0               128                               [::]:22                                [::]:*


//配置生效之后,去服务端测试
测试之前先做些测试的准备工作
设置文件权限。因为zabbix服务端访问客户端属于其他,如果
文件的其他人没有读的权限,则无法监控该项
[root@web ~]# ll /var/log/httpd/error_log
-rw-r--r-- 1 root root 1044 Sep 12 12:57 /var/log/httpd/error_log
[root@web ~]# ll -d /var/log/httpd/
drwx------. 2 root root 4096 Aug  2 09:39 /var/log/httpd/
[root@web ~]# chmod 755 /var/log/httpd/
[root@web ~]# ll -d /var/log/httpd/
drwxr-xr-x. 2 root root 4096 Aug  2 09:39 /var/log/httpd/

//因之前本地测试脚本生成了该文件,该文件的属组是本地的root用户
//需本地测试完后删掉,在server执行脚本生成新的文件
[root@web ~]# ll /tmp/logseek
-rw-r--r-- 1 root root 4 Sep 12 12:57 /tmp/logseek
[root@web ~]# rm -f /tmp/logseek

服务端测试
[root@localhost local]# zabbix_get -s 192.168.91.137 -k check_log['/var/log/httpd/error_log']
1                //会输出1是因为之前测试往httpd的error_log文件追加了‘Error’,前面又把测试的logseek记录检查文件给删除了,这是执行脚本会生成新的logseek文件,该文件会从头开始,所以检测出‘Error’

//再次执行就不会输出1了,因为再次检测从上次检测的尾部之后开始,故当前error日志没有‘Error’信息
[root@localhost local]# zabbix_get -s 192.168.91.137 -k check_log['/var/log/httpd/error_log']
0

//去到agent查看新生成的logseek记录检查文件,可以看到属主是zabbix
[root@web ~]# ll /tmp/logseek
-rw-rw-r-- 1 zabbix zabbix 4 Sep 12 13:11 /tmp/logseek
在zabbix服务端web界面添加监控项
跟添加进程监控的步骤流程一致,只需改变些操作,具体可以参考上面的
添加触发器
触发验证
手动触发告警
[root@web ~]# echo 'Error' >> /var/log/httpd/error_log
进入监控栏的仪表板界面查看,发现触发了告警,邮箱也收到了告警信息。